2013 Regional Virginia Youth Survey Results
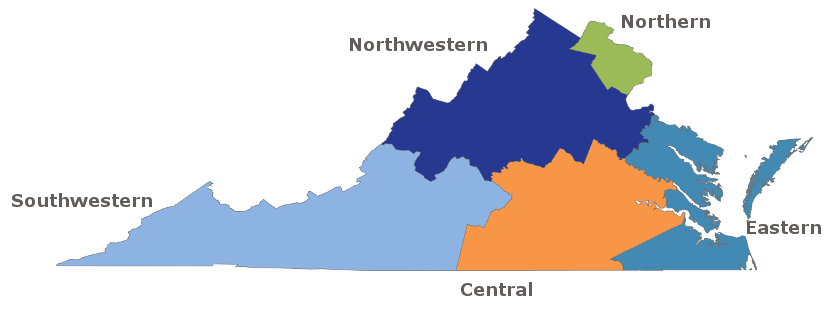
Regional data are available for the five public health regions shown below. Results are not available for individual school or divisions. For a listing of Virginia public school divisions by health region please look here.
Virginia Health Regions

Central
Middle School - the VYS was completed by 1,602 middle school students in 26 public schools. The school response rate was 96%, the student response rate was 89%, and the overall response rate was 85%.
- Graph Results (PowerPoint)
- Summary Tables (Each question with percentages by gender, age, grade, and race/ethnicity)
- Statistical Report (confidence interval, standard error, and design effect for each question)
High School - the VYS was completed by 1,794 high school students in 25 public schools. The school response rate was 93%, the student response rate was 76%, and the overall response rate was 70%.
- Graph Results (PowerPoint)
- Summary Tables (Each question with percentages by gender, age, grade, and race/ethnicity)
- Statistical Report (confidence interval, standard error, and design effect for each question)
Eastern
Middle School - the VYS was completed by 1,783 middle school students in 27 public schools. The school response rate was 100%! The student response rate was 79%, and the overall response rate was 79%.
- Graph Results (PowerPoint)
- Summary Tables (Each question with percentages by gender, age, grade, and race/ethnicity)
- Statistical Report (confidence interval, standard error, and design effect for each question)
High School - the VYS was completed by 1,340 high school students in 24 public schools. The school response rate was 89%, the student response rate was 76%, and the overall response rate was 67%.
- Graph Results (PowerPoint)
- Summary Tables (Each question with percentages by gender, age, grade, and race/ethnicity)
- Statistical Report (confidence interval, standard error, and design effect for each question)
Northern
Middle School - the VYS was completed by 1,477 middle school students in 23 public schools. The school response rate was 85%, the student response rate was 77%, and the overall response rate was 65%.
- Graph Results (PowerPoint)
- Summary Tables (Each question with percentages by gender, age, grade, and race/ethnicity)
- Statistical Report (confidence interval, standard error, and design effect for each question)
High School - the VYS was completed by 1,070 high school students in 18 public schools. The school response rate was 67% and the student response rate was 83%. Because the overall response rate is 55% the surveys were not weighted, and the results are not available.
Northwestern
Middle School - the VYS was completed by 1,748 middle school students in 27 public schools. The school response rate was 100%! The student response rate was 88% and the overall response rate was 88%.
- Graph Results (PowerPoint)
- Summary Tables (Each question with percentages by gender, age, grade, and race/ethnicity)
- Statistical Report (confidence interval, standard error, and design effect for each question)
High School - the VYS was completed by 1,583 high school students in 27 public schools. The school response rate was 100%! The student response rate was 80% and the overall response rate was 80%.
- Graph Results (PowerPoint)
- Summary Tables (Each question with percentages by gender, age, grade, and race/ethnicity)
- Statistical Report (confidence interval, standard error, and design effect for each question)
Southwestern
Middle School - the VYS was completed by 1,626 middle school students in 26 public schools. The school response rate was 96%, the student response rate was 83%, and the overall response rate was 80%.
- Graph Results (PowerPoint)
- Summary Tables (Each question with percentages by gender, age, grade, and race/ethnicity)
- Statistical Report (confidence interval, standard error, and design effect for each question)
High School - the VYS was completed by 1,220 high school students in 22 public schools. The school response rate was 81%, the student response rate was 83% and the overall response rate was 68%.
- Graph Results (PowerPoint)
- Summary Tables (Each question with percentages by gender, age, grade, and race/ethnicity)
- Statistical Report (confidence interval, standard error, and design effect for each question)
Centers for Disease Control and Prevention - Youth Risk Behavior Surveillance System (YRBSS)
National and State level data from states that participate in the survey

