
On this page: Dashboard Guide | Virginia ACH Facilities | Statewide SIR | Statewide SUR | Hospital-Specific Report | Device Associated Events | Device Utilization | Surgical-site Infections | Lab Identified Events | HCP Influenza Vaccination
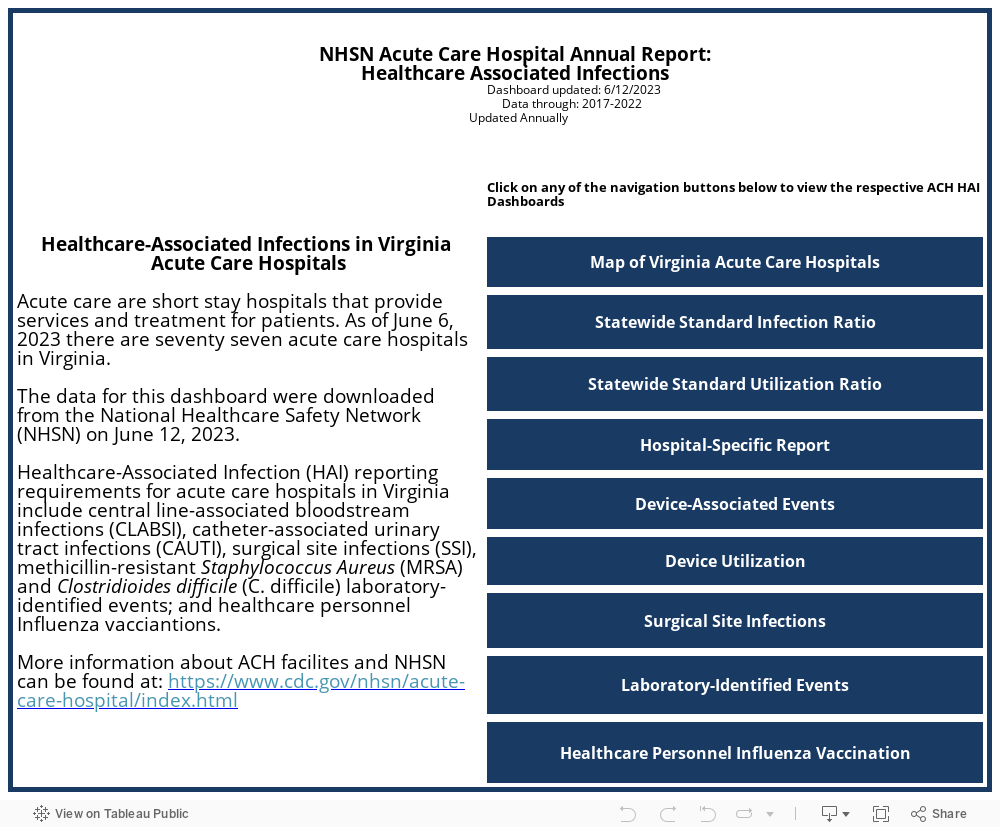
The HAI/AR Program produces annual reports to inform facilities and prevention responses to help reduce healthcare-associated infections (HAI) among acute care hospital (ACH) patients in the commonwealth of Virginia.
Healthcare-associated infections (HAIs), formerly known as nosocomial infections, are infections acquired while receiving medical care. Patients can get them from routine care, surgery, as a complication from the use of medical devices such as ventilators or catheters, or as a side effect of the overuse of antibiotics.
For more information, please refer to the links posted under the “Navigation” section.
Download NHSN HAI ACH data.
Introduction to the HAI ACH Annual Report Dashboard (Navigation)
Guide
Data collected for the following years were downloaded from the National Healthcare Safety Network (NHSN) on the respective dates: 2023: July 2, 2024; 2022: June 12, 2023; 2021: August 19,2022; 2020: July 27, 2021; 2019: July 1, 2020; 2018: July 25, 2019.
Any changes made to the data after these dates are not reflected in the results. The 2020 NHSN Annual Hospital Survey was used to gather information on hospital characteristics (e.g., hospital bed size and medical school affiliation).
Definitions:
- VDH Health Planning Region: There are five public health planning regions in Virginia (Central, Eastern, Northern, Northwest, Southwest). The health planning regions allow public health to conduct surveillance in areas with evenly distributed populations.
- Healthcare Coalition Region: Through a partnership between VDH and the Virginia Hospital & Healthcare Association (VHHA), the Virginia Healthcare Emergency Management Program was created, and Virginia hospitals and healthcare systems have enhanced their capabilities to respond and recover from a wide range of public health and healthcare emergencies. VDH and VHHA work with hospitals and healthcare facilities through a regional structure that consists of six healthcare coalitions (Central, Eastern, Northern, Northwest, Far Southwest, Near Southwest). More information can be found on the Emergency Preparedness website.
- Hospital System: A hospital system or healthcare system is two or more hospitals owned, sponsored, or contract managed by a central organization.
- Medical School Affiliation: Medical School Affiliation equals ‘Yes’ if the hospital answered ‘Yes’ to the following question on the NHSN Patient Safety Component Annual Hospital Survey: Is your hospital a teaching hospital for physicians and/or physicians-in-training? Includes major teaching (facility has a program for medical students and post-graduate medical training (i.e., residency and/or fellowships), graduate teaching (facility has a program for post-graduate medical training, i.e., residency and/or fellowships only), or undergraduate (facility has a program for medical students only).
- Bed Size: Bed Size is defined as the number of beds set up and staffed in all inpatient locations.
- Standardized Infection Ratio (SIR) = Number of observed infections / Number of predicted infections: The standardized infection ratio (SIR) was used to characterize hospital HAI performance. The SIR shows whether a hospital had significantly more HAIs, fewer HAIs, or about the same number of HAIs compared to the number predicted for that hospital based on national baseline data from 2015.
- The SIR is a summary measure that can be used to track HAIs over time and can be calculated on a variety of levels, such as unit, facility, state, and nation. The SIR adjusts for differences between hospitals, such as types of patients and procedures, as well as other factors. The risk adjustment and factors for each HAI type can be found in the CDC NHSN SIR guide. The measure compares the number of infections reported in a given time period to the number of infections that would be predicted using national data from a baseline time period, which is currently calendar year 2015.
- The SIR value can be interpreted as follows:
- If the SIR Interpretation is Better, then the number of observed infections was significantly lower than the number predicted.
- If the SIR Interpretation is Same, then the number of observed infections did not significantly differ from the number predicted.
- If the SIR Interpretation is Worse, then the number of observed infections was significantly higher than the number predicted.
- If the SIR Interpretation is No Conclusion, then the SIR was not calculated because the number of predicted infections was less than 1.
- Standardized Utilization Ratio (SUR) = Number of observed device days / Number of predicted device days: The standardized utilization ratio (SUR) measures device utilization and is a scalable, risk-adjusted measure that can be compared across locations and facilities. SURs indicate whether the observed number of device days is higher, lower, or similar to the predicted number of device days based on national baseline data from 2015.
- For non-NICU locations in acute care hospitals, central line and catheter SURs are risk-adjusted for type of facility, medical school affiliation, number of inpatient beds, and type of patient care location. The SUR for central lines in NICU locations are adjusted for type of facility, medical school affiliation, number of inpatient beds, type of NICU (Level II/III vs. Level III), and birthweight of NICU patient.
- Central Line Associated Bloodstream Infection (CLABSI): A laboratory confirmed bloodstream infection where an eligible bloodstream infection (BSI) organism is identified, and an eligible central line is present on the laboratory confirmed bloodstream infection date of event or the day before.
- Catheter-associated UTI (CAUTI): A UTI where an indwelling urinary catheter (IUC) was in place for more than two consecutive days in an inpatient location on the date of event or the day before, with day of device placement being Day 1.
- Surgical Site Infection (SSI): An infection that occurs after surgery in the part of the body where the surgery took place.
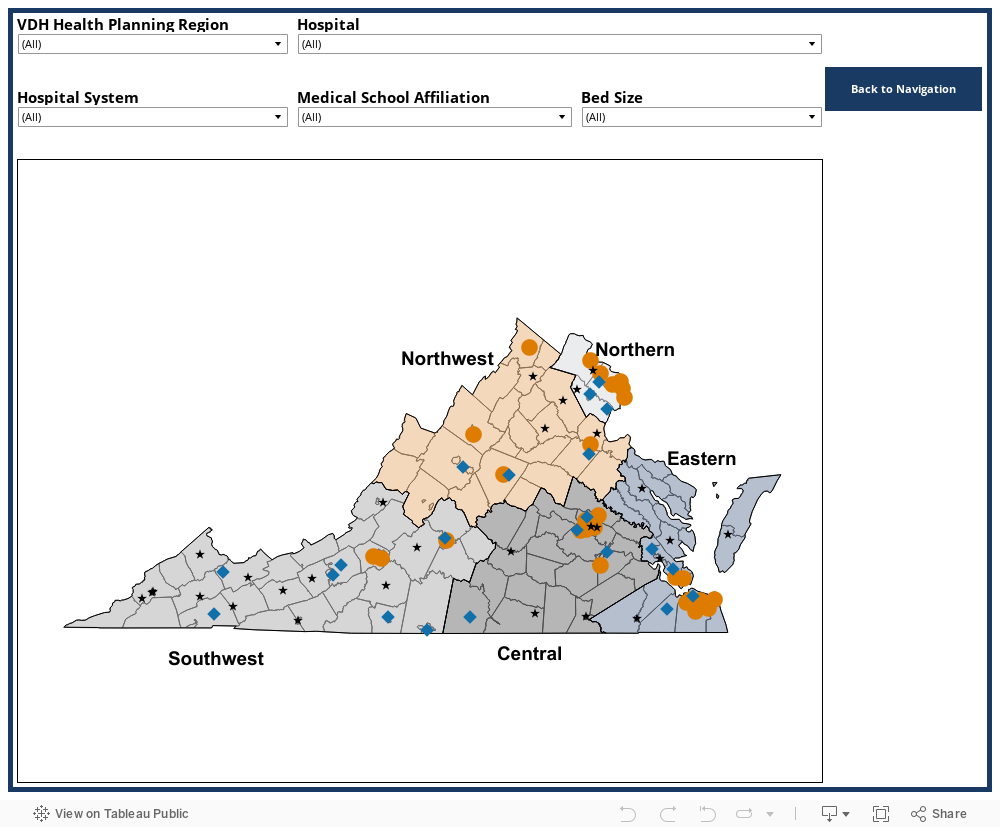
Map
This tab displays the location of acute care hospitals that are reporting in NHSN. Each of the five VDH Health Planning Regions are represented by different colors.
Hospitals are represented by shapes of different colors and sizes:
- Black Star: Smallest hospitals (≤100)
- Blue Diamond: Medium sized hospitals (101-200)
- Orange Circle: Largest hospitals (>200)
For more information about each hospital, hover over the circles on the map.
Use the filters in the menu to view certain hospitals.
To highlight hospitals of a particular bed size, click the highlighter button to the right of ‘Bed Size Category’ then select one of the categories.
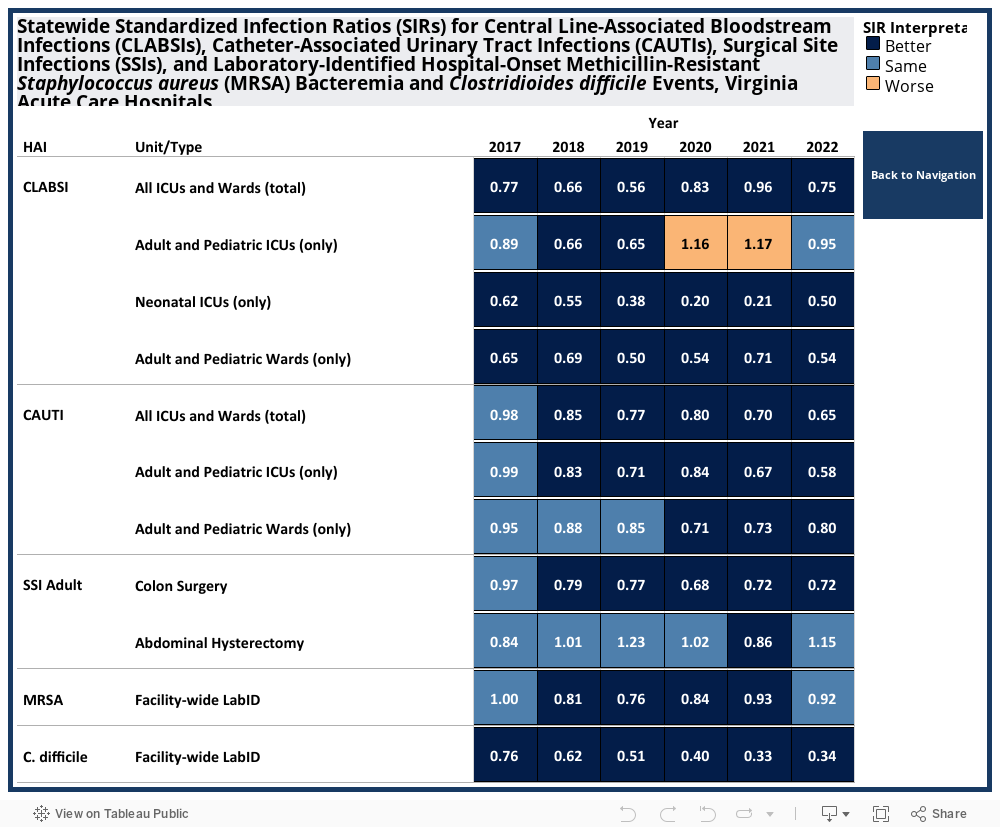
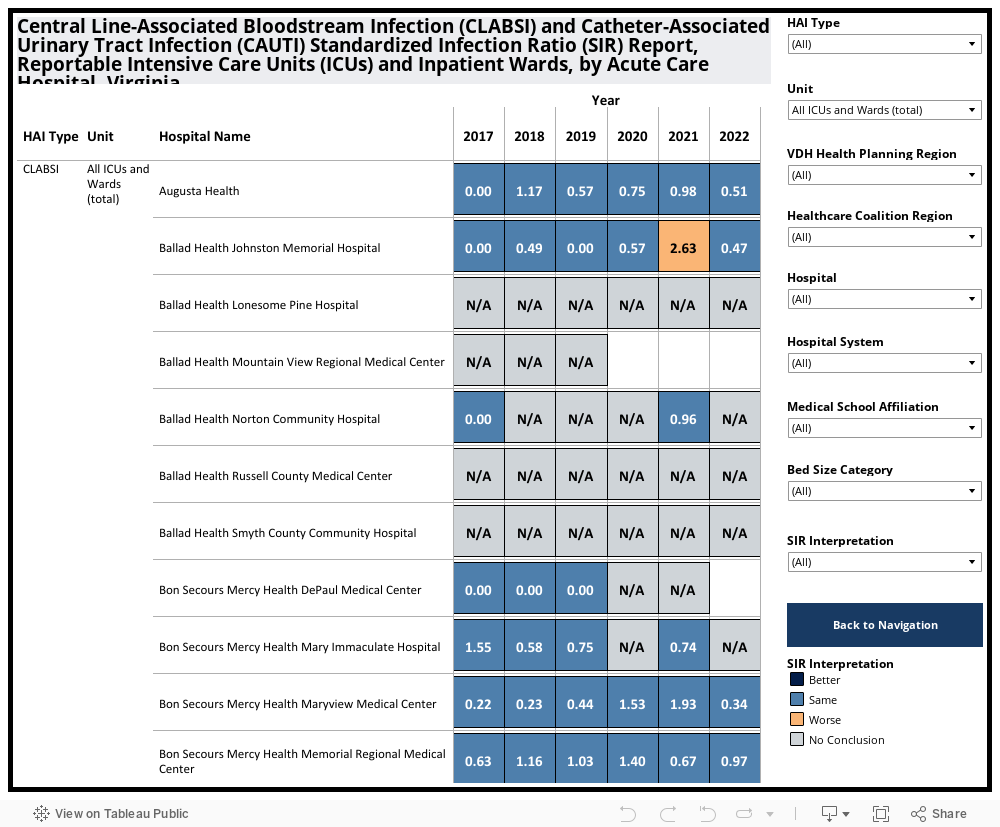
Statewide SIR
This tab displays statewide SIR data for all reportable HAIs by year. SSI SIRs are based on the complex admission/readmission model for adult patients (≥18 years). More information on this model can be found can be found in the CDC NHSN SIR Guide.
NHSN has a separate CLABSI and CAUTI risk model for oncology intensive care units (ICUs); these data are not shown separately here. Oncology ICUs are included in the total for CLABSI and CAUTI but are excluded from the ICU only data. Hospital-specific CLABSI and CAUTI totals in subsequent tables include oncology ICUs.
Inpatient ward locations included are adult and pediatric medical, surgical, and medical/surgical wards.
For more information about each SIR, hover over the SIR values in the table.
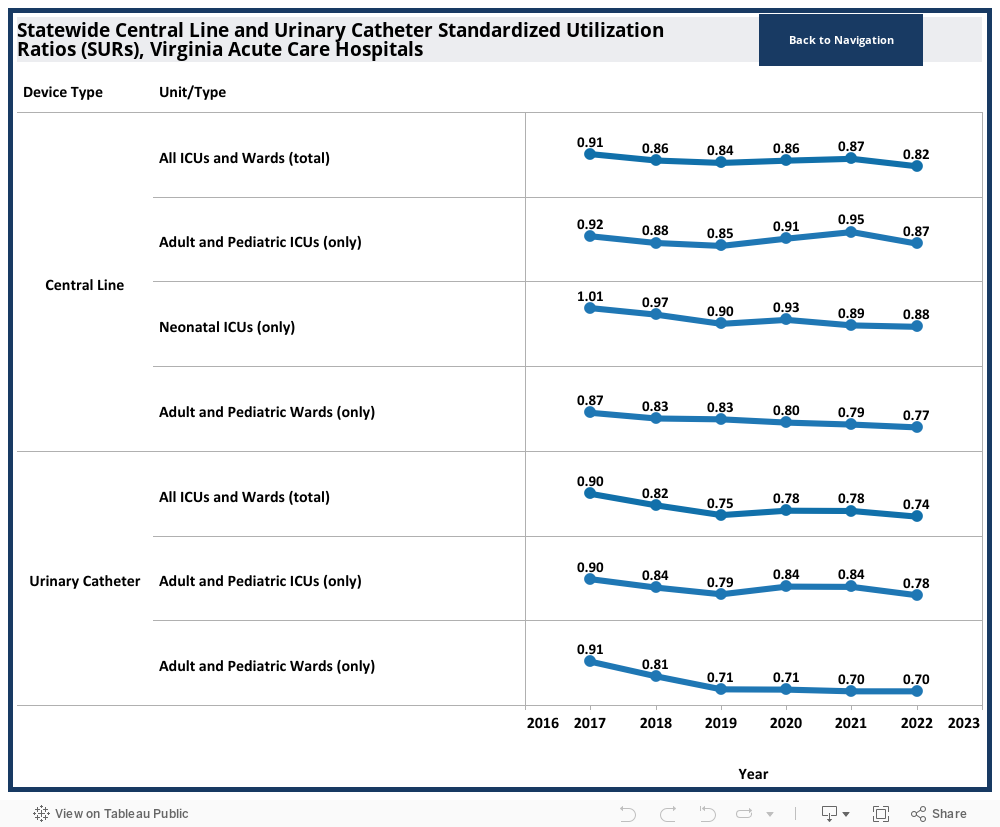
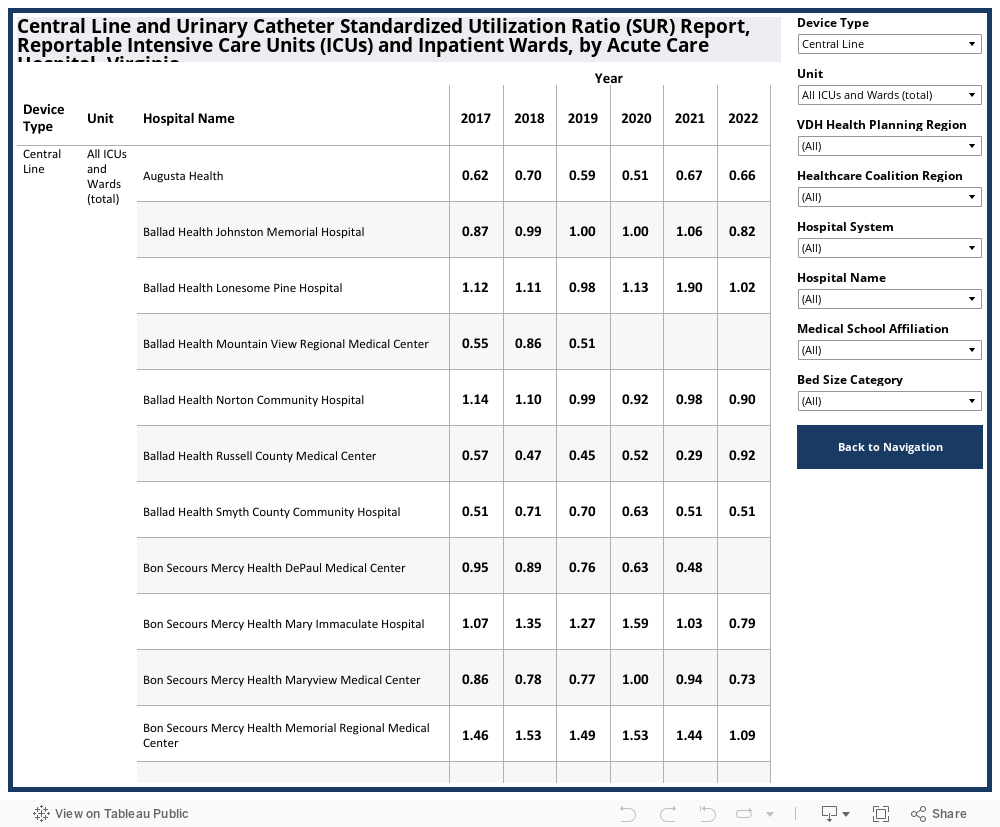
Statewide SUR
This tab displays statewide SUR data for central lines and urinary catheters by year. NHSN has a separate risk model for oncology intensive care units (ICUs); these data are not shown separately here. Oncology ICUs are included in the total for central line and catheter use but are excluded from the ICU only data.
Inpatient ward locations included are adult and pediatric medical, surgical, and medical/surgical wards.
For more information about each SUR, hover over the circles representing the SUR values in the graph.
Hospital-Specific Report
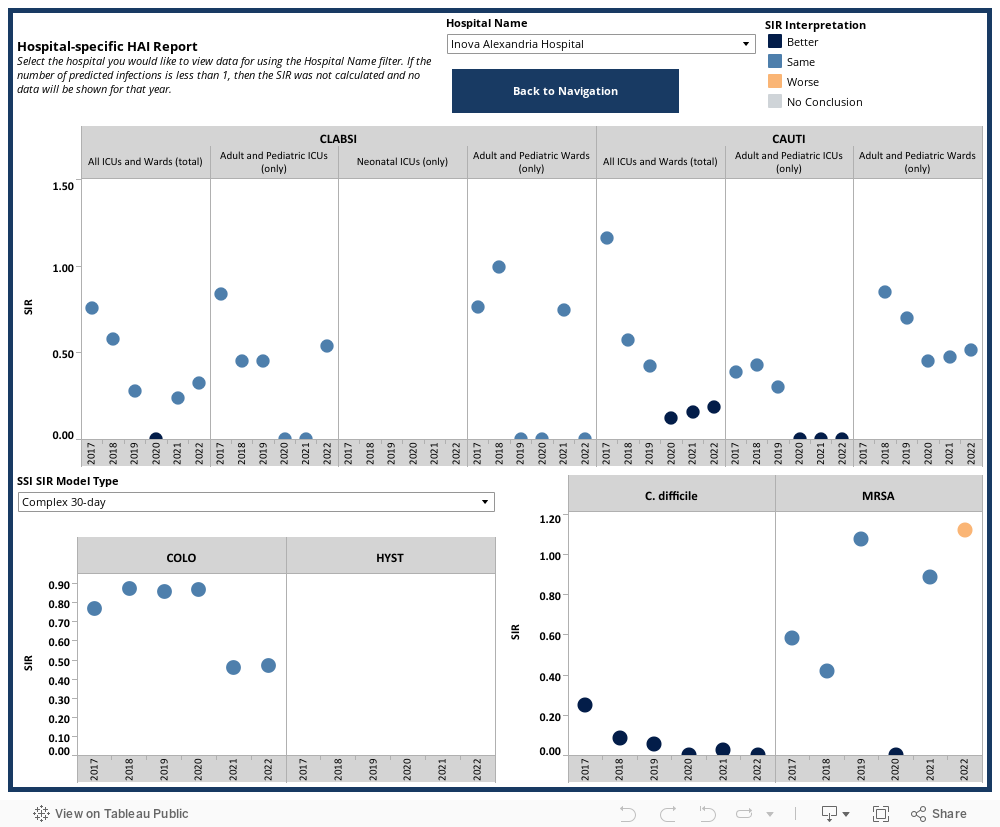
Device – Associated Events
This tab displays hospital-specific data on central line-associated bloodstream infections (CLABSIs) in adult, pediatric, and neonatal intensive care units (ICUs) and adult and pediatric medical, surgical, and medical/surgical wards, as well as hospital-specific data on catheter-associated urinary tract infections (CAUTIs) in adult and pediatric ICUs and adult and pediatric medical, surgical, and medical/surgical wards by year.
For more information about each hospital’s SIR, hover over the SIR values in the table.
Use the filters in the menu to view data for certain hospitals.
Device Utilization
This tab displays hospital-specific data on central line use in adult, pediatric, and neonatal intensive care units (ICUs) and adult and pediatric medical, surgical, and medical/surgical wards, as well as hospital-specific data on urinary catheter use in adult and pediatric ICUs and adult and pediatric medical, surgical, and medical/surgical wards by year.
For more information about each hospital’s SUR, hover over the SUR values in the table.
Use the filters in the menu to view data for certain hospitals.
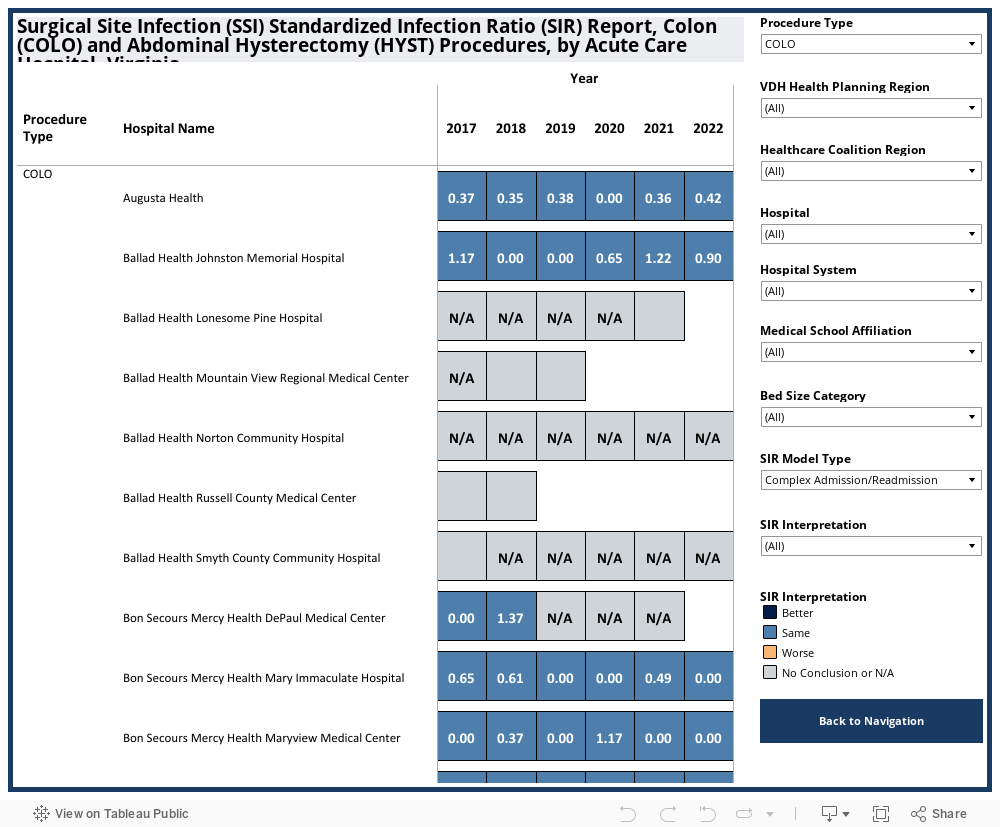
Surgical-Site Infections
This tab displays hospital-specific data on surgical site infections following colon procedures (COLO) and abdominal hysterectomies (HYST) in adult patients (≥18 years) by year. The model used to calculate the SSI SIR can be changed between the complex admission/readmission and the complex 30-day models. More information on these models can be found in the CDC NHSN SIR Guide.
If a hospital performed one or more surgical procedures during the year, but the number of predicted infections was less than 1, then “N/A” will appear in the table. When you hover over the cell, the SIR Interpretation will say “No Conclusion”.
If a hospital did not perform a surgical procedure or had no eligible procedures in that year, then the cell will appear blank in the table. When you hover over the cell, the SIR Interpretation will say “N/A”.
For more information about each hospital’s SIR, hover over the SIR values in the table.
Use the filters in the menu to view data for certain hospitals.
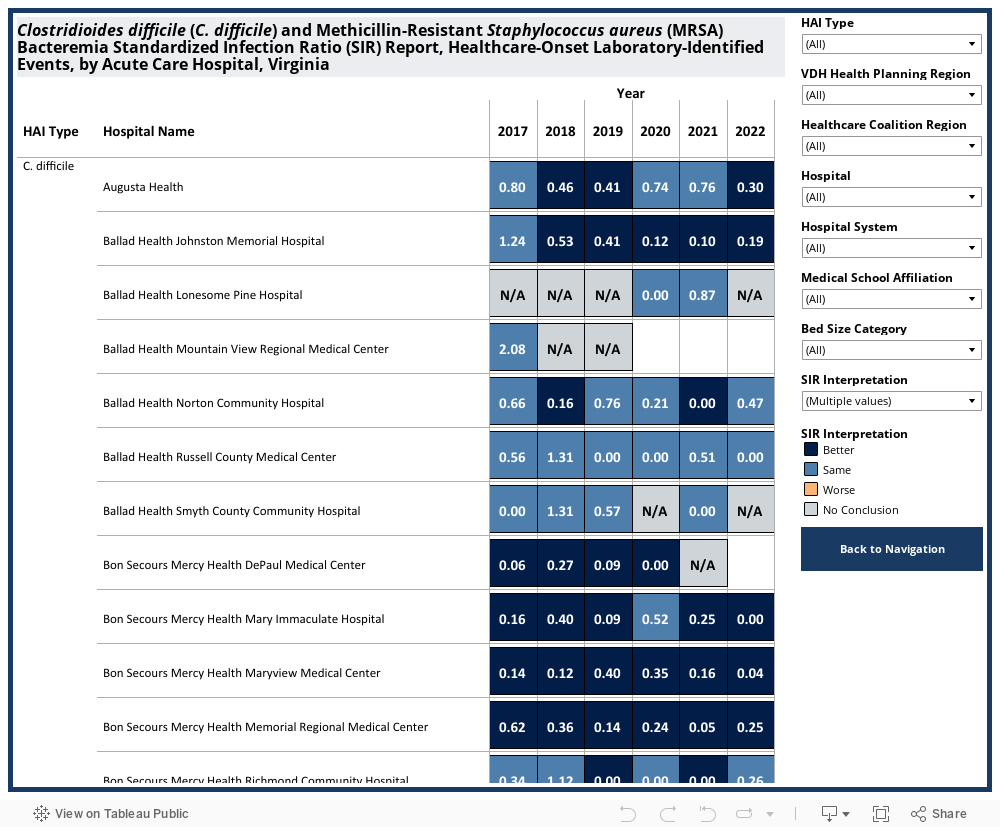
Laboratory-identified Events
This tab displays hospital-specific data on healthcare-onset laboratory-identified methicillin-resistant Staphylococcus aureus (MRSA) and Clostridiodes difficile (C. difficile) events by year.
For more information about each hospital’s SIR, hover over the SIR values in the table.
Use the filters in the menu to view data for certain hospitals.
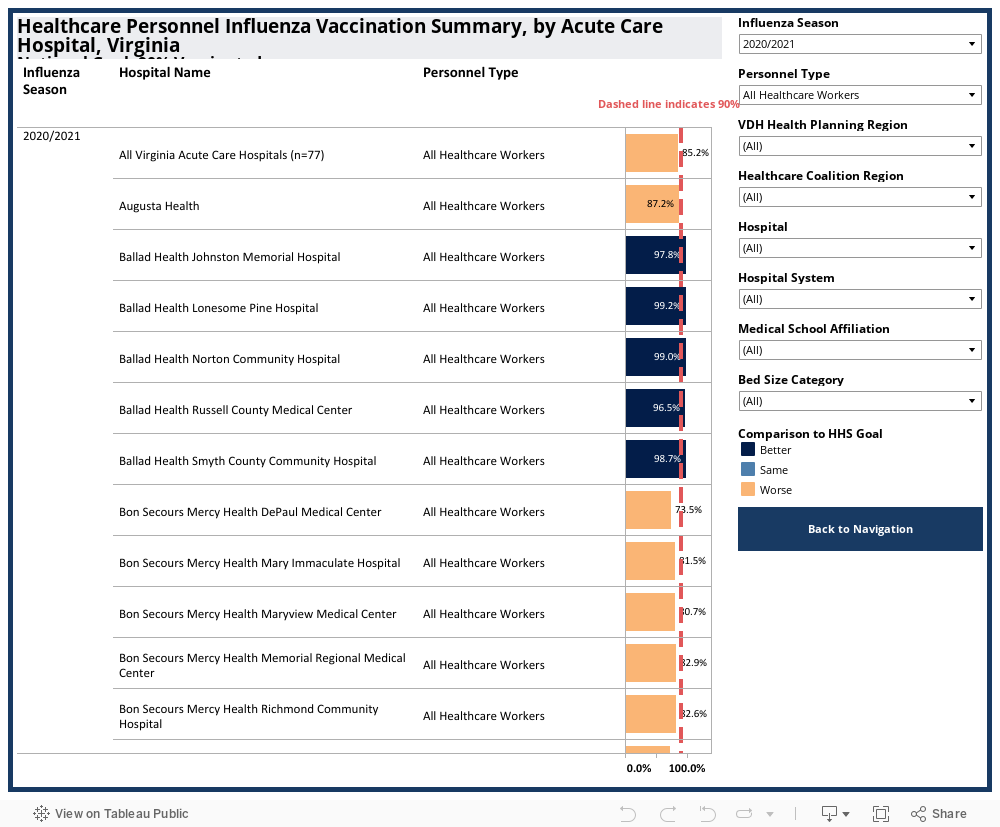
Healthcare Personnel Influenza Vaccination
‘Healthcare personnel’ and ‘healthcare workers’ are used interchangeably. ‘Influenza’ and ‘flu’ are used interchangeably. This tab displays the percentage of healthcare personnel (HCP) in each hospital who were vaccinated during each influenza season (October 1-March 31), starting with the 2012-2013 influenza season.
Healthcare personnel include employees, licensed independent practitioners, and adult students/trainees and volunteers. Contract personnel are excluded from all categories. The national Health and Human Services (HHS) Healthy People 2020 Goal is to have 90% of all healthcare personnel vaccinated for the flu every season.
For more information about each hospital’s HCP flu vaccination percentage, hover over the bars in the graph.
Use the filters in the menu to view data for certain hospitals.
To highlight HCP flu vaccination percentages that are Better, Same, or Worse, click the highlighter button to the right of ‘Comparison to HHS Goal’ and then select one of the categories.
Download NHSN HAI ACH data.