COVID-19 Vaccination Disparities and Social Determinants

The Social Determinants of Health (SDOH) are a major determinant of population health outcomes. Depending on how they are measured and defined, the SDOH may account for up to 90% of the variation in health outcomes between communities. COVID-19 is no exception. Previous analysis examined how factors such as race and ethnicity, occupation, poverty and rurality, and housing are playing a role in COVID-19 outcomes in Virginia and elsewhere. Access to health resources is often a factor underlying health disparities, while increasing access can help alleviate disparities created by other factors. In the case of COVID-19, access to vaccines by at-risk populations is essential to addressing disparities. The post examines vaccine disparities by poverty, rurality, and SDOH at the census tract level in Virginia as of August 26, 2021.

Poverty Level Disparities

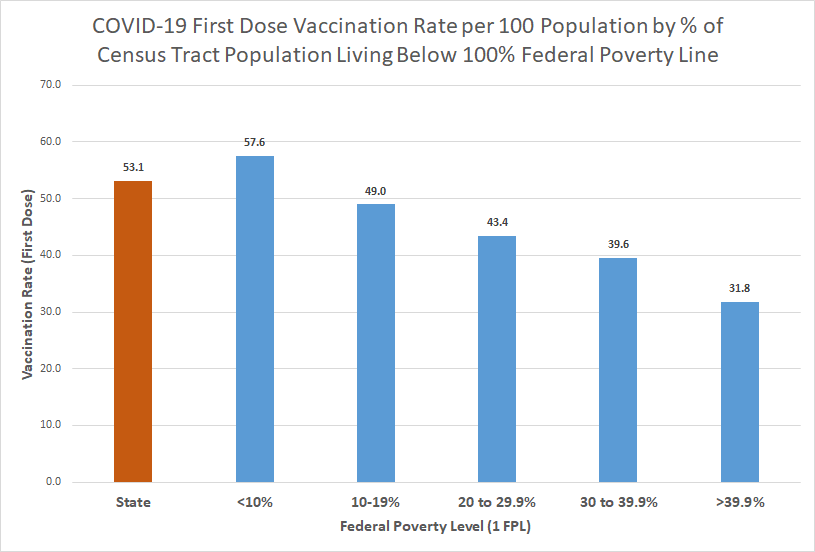
First Dose vaccination coverage varied widely by poverty level, with the highest coverage in those census tracts with less than 10% of the population living below 100% federal poverty level. However, the lowest coverage is found in census tracts with over 39.9% of the population living below 100% federal poverty level. One of the largest disparities in vaccination rates in Virginia is found among high and low census tract poverty levels.


Health Opportunity Index Disparities

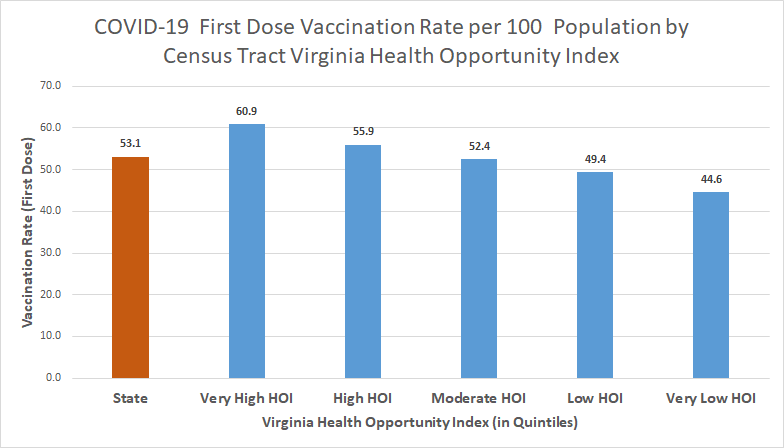
The Virginia Department of Health provides the Virginia Health Opportunity Index (HOI) which is a composite measure of the social determinants of health – the social, economic, educational and environmental factors that relate to a community’s well-being – at the census tract level. The index is divided into 5 levels – very high, high, moderate, low, and very low – and census tracts can be grouped into these 5 levels. Vaccination coverage was higher in high health opportunity census tracts than in low health opportunity census tracts. Persons living in the very high health opportunity census tracts were 37% more likely to be vaccinated as those in very low health opportunity census tracts.


Rurality Disparities

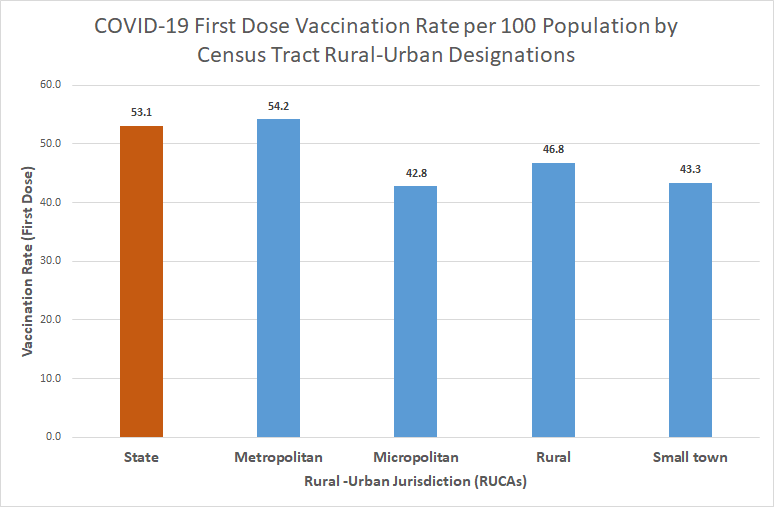
Rural and urban census tracts were classified by the Rural-Urban Commuting Area (RUCA) taxonomy and then further classified into groups – metropolitan, micropolitan, small town and rural. Based on the chart, it can be seen that, people living in metropolitan areas have a higher rate of COVID-19 first dose vaccination than those living in rural areas.  People living in metropolitan areas are 16% more likely to have received their first vaccination than those in the rural areas.


COVID-19 Death Disparities by Census Tract Poverty Level, Health Opportunity Index and Rurality

by Michael Landen & Rexford Anson-Dwamena

COVID-19 Death Disparities by Census Tract Poverty Level, Health Opportunity Index and Rurality

Disparities for key COVID-19 indicators by race/ethnicity in Virginia and the United States have been well documented (see March 8, 2021 COVID-19 Health and Disease Disparities by Race and Ethnicity in Virginia blog post). This report focuses on COVID-19 death rate disparities for adults 35-54 years of age in Virginia by census tract level poverty, health opportunity index and rurality. The entire age range was not used for this analysis because subpopulations, such as those with different poverty levels, have different age structures and therefore can’t be fairly compared for an outcome that is associated with age such as COVID-19 death. The 35-54 year age group was chosen for these comparisons because it is the youngest age group with sufficient numbers of deaths to allow for reasonable death rate comparisons at the census tract level.

Poverty Level Disparities

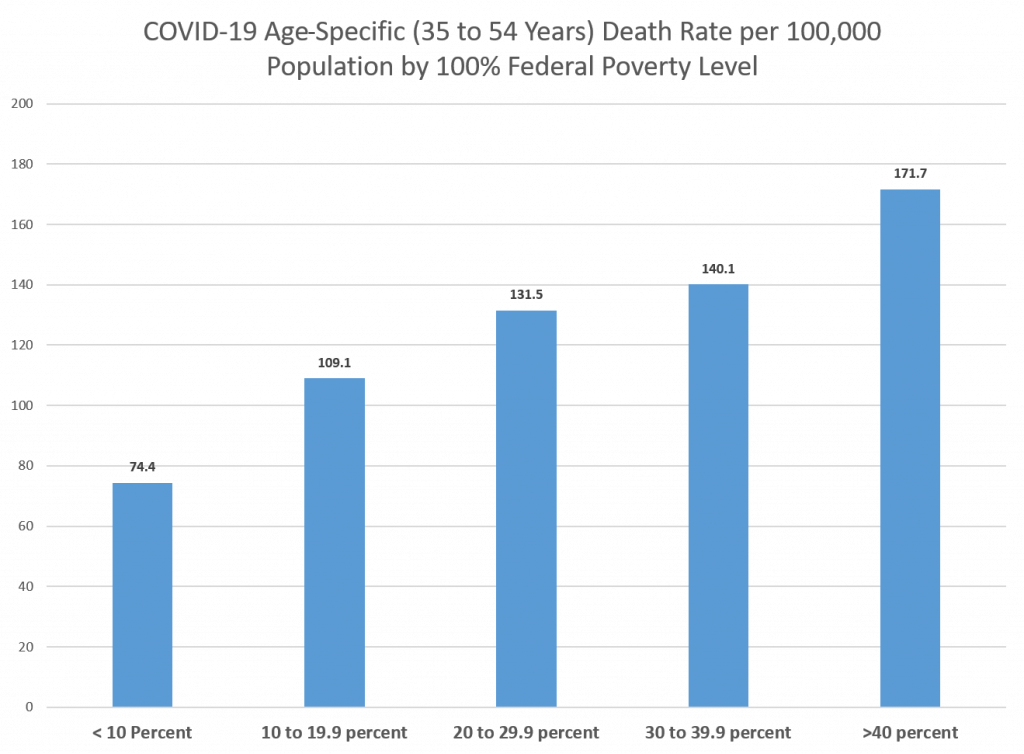
A person’s income is not included in their death records, however, the percentage of persons living below the federal poverty level by census tract is available. COVID-19 deaths among persons 35-54 years of age can be grouped by this percentage. The largest disparity in the COVID-19 death rate was found between those living in census tracts with the greatest percentage of persons living in poverty, >= 40%, and those living in census tracts with the lowest percentage of persons living in poverty, < 10%. Persons living in census tracts with the highest percentage of people in poverty were 2.3 times more likely to die of COVID-19 than those from the lowest poverty census tracts (Figure 1).

Figure 1.  COVID-19 Death Rates per 100,000 persons aged 35-54 years by Census Tract Percentage of Persons Living below the Federal Poverty Level, Virginia, March 2020 – April 2021


Health Opportunity Index Disparities

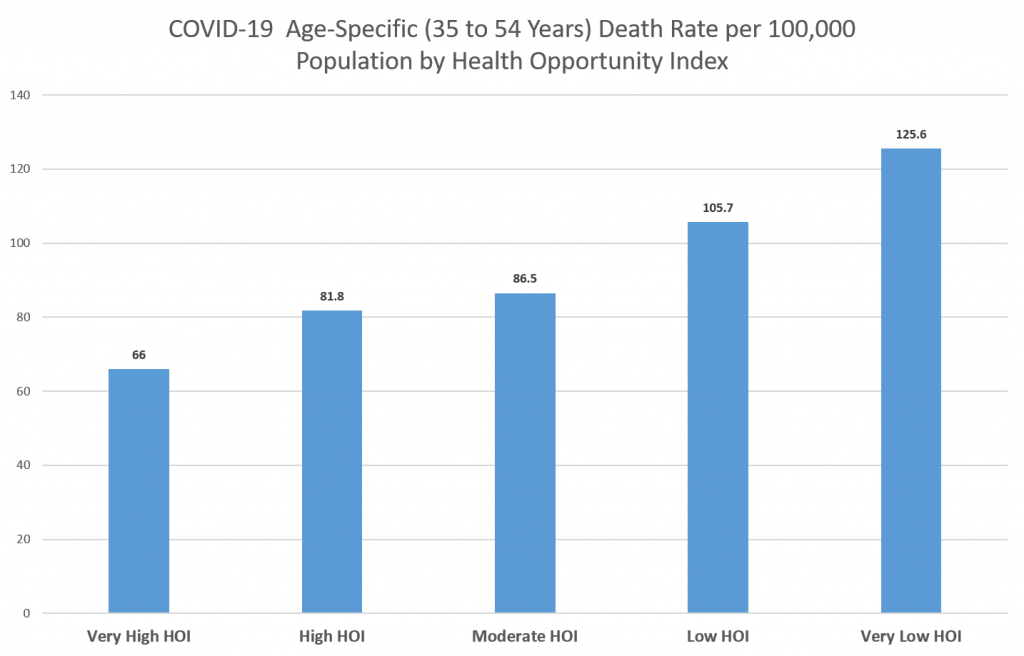
The Virginia Department of Health provides the Virginia Health Opportunity Index (HOI) which is a composite measure of the social determinants of health – the social, economic, educational and environmental factors that relate to a community’s well-being – at the census tract level. The index is divided into 5 levels – very high, high, moderate, low, and very low – and census tracts can be grouped into these 5 levels. In general, persons living in census tracts with a higher HOI tend to have lower disease and death rates.  COVID-19 deaths among persons 35-54 years of age can be grouped by the level of HOI for the census tract in which they reside. The largest disparity in the COVID-19 death rate for this age group was found between those living in census tracts with the lowest HOI and those living in census tracts with the highest HOI. Persons living in census tracts with the lowest HOI were 1.9 times more likely to die of COVID-19 than those from census tracts with the highest HOI (Figure 2).


Figure 2.  COVID-19 Death Rates per 100,000 persons aged 35-54 years by Census Tract HOI, Virginia, March 2020 – April 2021


Rurality Disparities

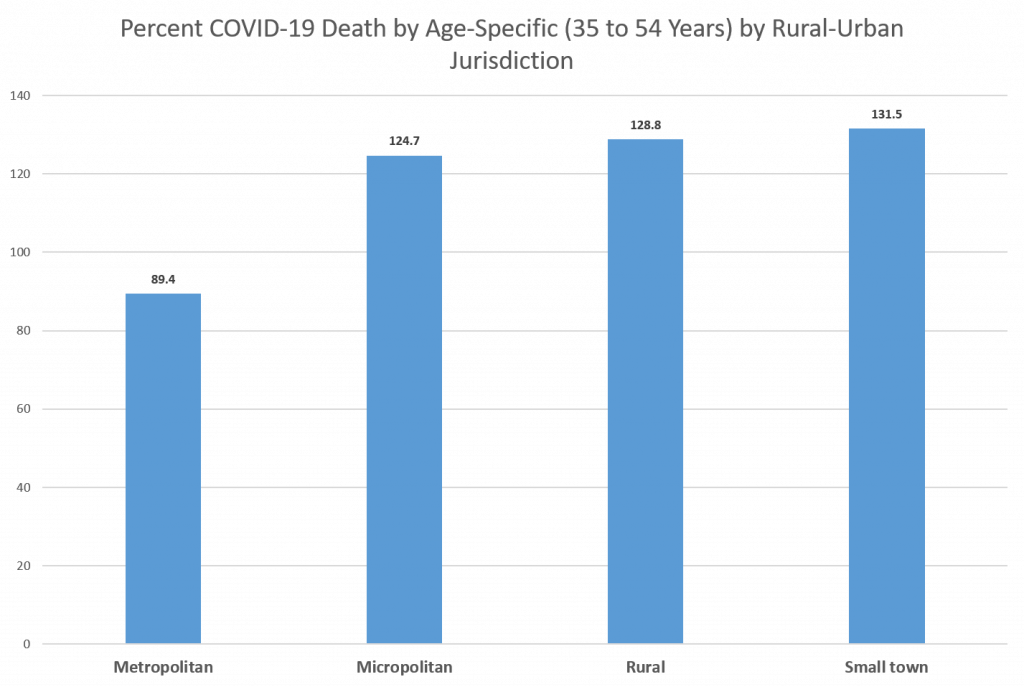
Persons living in rural areas, in general, tend to have higher disease and death rates than those living in metropolitan areas. Rural and urban census tracts can be classified by the Rural/Urban Community Area (RUCA) taxonomy and then further classified into groups – metropolitan, micropolitan, small town and rural.  COVID-19 deaths among persons 35-54 years of age can be grouped by these RUCA groups for the census tract in which they resided. The largest disparity in the COVID-19 death rate for this age group was found between those living in small town census tracts and those living in metropolitan census tracts. Persons living in small town census tracts were 1.5 times more likely to die of COVID-19 than those from metropolitan census tracts, and both persons from micropolitan census tracts and persons from rural census tracts were 1.4 times more likely to die of COVID-19 than those from metropolitan census tracts (Figure 3).

Figure 3.  COVID-19 Death Rates per 100,000 persons aged 35-54 years by Census Tract RUCA, Virginia, March 2020 – April 2021

COVID-19 death rates for those 35-54 years are higher in non-metropolitan communities and for persons living in communities with a higher percentage of people living in poverty in Virginia. This is not surprising since many health indicators are worse for communities with high poverty rates and for rural communities. In general, these communities may have fewer opportunities than communities with lower poverty and metropolitan communities. One approach to reducing these disparities is to increase social, economic, vocational and educational opportunities in these high poverty communities and rural communities. An “opportunity” specifically related to COVID-19 is vaccination, and these vaccinations should continue to be prioritized for persons in rural communities and those with high poverty rates or percentages.